|
| home > Introduction |
|
| VI. Market Size | ||||
|
Figure 1-13 and Figure 1-14 present the results of the Fact-Finding Study on Real Estate Securitization issued annually by the Ministry of Land, Infrastructure and Transport that has been conducted annually since 1997. They are graphical presentations of the results published in the “Annual Report on Land Trends” (the “Land White Papers”). These figures were collated through independent research by MLIT and are currently the only data available for estimating the market size. Figure 1-13 History of Real Estate Securitization by Asset and Quantity *Click the image, large size is available 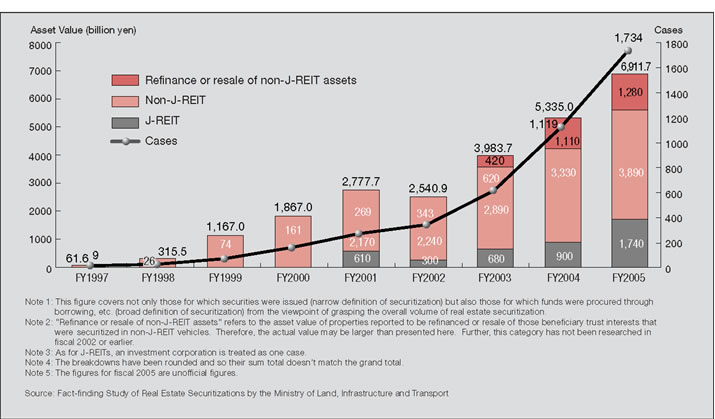 Figure 1-14 Asset Amount of Securitized Real Estate by Usage *Click the image, large size is available 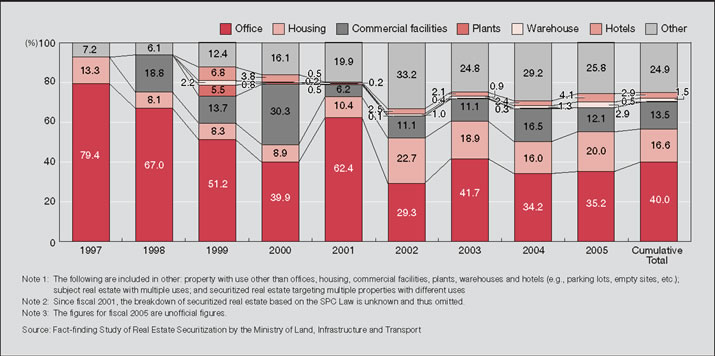 After asset value temporarily decreased in fiscal 2002, the market began to rapidly grow hitting approximately 4 trillion yen in assets in fiscal 2003 and then growing further to approximately 6.9 trillion yen in assets (increase of 30%) with 1,734 transactions (155% increase) in fiscal 2005. The breakdown of the 6.9 trillion yen is 1.7 trillion yen for J-REITs (25%) and 3.9 trillion yen (56%) for non-J-REITs. Of the non-J-REIT assets, property refinanced or sold accounted for 1.3 trillion yen (19%). A simple cumulative sum of the figures for the nine years from fiscal 1997 through fiscal 2005 reveals a total value of approximately 25 trillion yen, of which real estate owned by J-REIT investment corporations accounts for approximately 4.2 trillion yen representing approximately 17% of the total. Figure 1-14 details the breakdown of securitizations by real estate asset class and illustrates the significant change in the composition since fiscal 1997. In fiscal 2005, offices accounted for 35.2%, housing 20.0%, retail properties 12.1% and plants, warehouses, hotels and other properties (including multi-use) accounted for 32.7%. Relatively speaking, offices have dropped in significance and the relative share of other property classes is increasing. J-REITs and private funds have a massive presence in the real estate investment market. Private funds are generally interpreted to account for a significant majority of the Non J-REITs in Figure 1-13. However, compared to J-REITs it is difficult to grasp the actual condition of private funds and the scale of them has only been grasped to the extent of tabulating figures in reported materials and making estimates. The following overview of the private fund market is provided as a reference and is based on the tabulated results of the First Private Fund Fact Finding Study of Members conducted by ARES in February-March 2006 (does not necessarily cover the entire market). Of the 228 ARES member companies, 56 managed private funds as of the end of December 2005. The total assets under management of these 56 companies was about 6.1 trillion yen and they managed 430 funds with a total of 2,656 properties. This is about 2.7 trillion yen more than the assets under management of J-REITs at the same time as shown in Figure 1-15 (based on the acquisition price). Figures 1-16 and 1-17 represent the types of real estate owned by the number of properties owned and the value of assets under management (in both cases this is a breakdown of the valid responses of 2,241 properties). Of the properties, rental housing totals 1,091 properties and comprises about half of the total and offices are the next most held property with 676 properties (about 30%). When analyzed by the value of assets under management, the value of the office properties reaches about 1.9 trillion yen or about 45% of the total, while rental housing reaches about 700 billion yen or about 18% of the total. Since this was the first time for the study to be conducted, there is no comparison available to show trends and the history of the private fund market but this analysis should be possible as ARES continues to conduct this study. Figure 1-15: Comparison of Assets Under Management by J-REITs and Private Funds (as of December 2005) *Click the image, large size is available 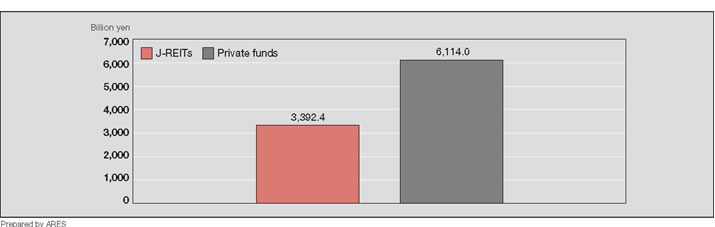 Figure 1-16: Types of Real Estate Owned by Private Funds (Based on Quantity of Properties Owned) (as of December 2005) *Click the image, large size is available  Figure 1-17: Types of Real Estate Owned by Private Funds (Based on Value of Assets Under Management) (as of December 2005) *Click the image, large size is available 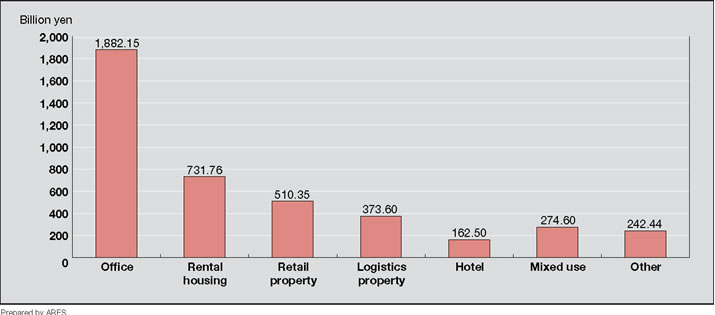 |
||||
|
||||